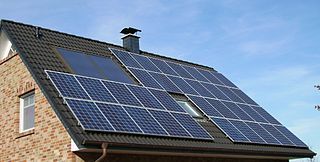
Solar Energy – Making It Happen in the U.S.
It’s no secret that the U.S. lags most of the rest of the developed world in terms of the adoption of renewable energy. It would be nice if there were a singular cause for this that we could simply identify and eliminate, but it’s not that simple. Sure, there’s the bickering on Capitol Hill, where an entire party is calling for a rollback of environmental regulation and the end to governmental support for green energy. And sure, this type of stupidity is quite damaging to any vision we Americans may have as potential leaders in the clean energy space in the 21st Century.
But a significant portion of the problem here isn’t that obvious; part of it is the enormous amount of bureaucracy we put up around a process as simple as an individual homeowner’s wanting to install solar panels on his roof. A new study from the Lawrence Berkeley National Laboratory (LBNL) puts some hard numbers to the benefits realized when U.S. cities streamline their solar PV permitting processes.
Here’s an article that discusses this, in the context of Germany’s residential solar adoption, which is attributed to thoughtful policies and incentives – as well as friendly permitting processes.
Meanwhile, in the U.S., “soft” costs amount for more than half of the installed price for residential solar PV systems in the US. Various studies have pointed out the results:
- Customer acquisition costs are ten times higher in the U.S. vs. Germany, $0.67 vs. $0.06, and “overhead” adds up to $1.24/W, or $5,000 for the average system (Solar Freedom Now)
- $0.22/W on average for permitting + inspection + interconnection, including $0.09/W in fees (NREL)
- Local permitting and inspection adds $0.50/W, or $2,500 per residential install, and nearly a month of delays (SunRun)
- Labor costs alone add $0.11/W, and eight weeks average permitting time (Clean Power Finance)
The new LBNL study (slides here) assembles permitting process scores from the DoE’s Rooftop Solar Challenge, the California Solar Initiative, and U.S. Census Data. All told it encompasses more than 3,200 residential PV systems installed in 44 California cities during 2011, representing 27 percent of the state’s total population and 20 percent of the state’s PV systems sized <10 kW installed in that year.
At the risk of stating the obvious, it sure would be good to model our approach after Germany, a shining example of success in this space.

