From Guest Blogger John Robbins: Energy Use – Create Personal Standards and Expectations

People need direct and clear instructions, like road signs or charts in a doctors office. A speed limit sign doesn’t say “Slow speed by 20%” when entering a school zone. It says “Do not exceed 20 mph”. If a doctor reports cholesterol is higher than it should be, he recommends how to cut enough get it down into a healthier range. The blood test result is a number and the healthy target is a number. Speed road signs and common health matters (cholesterol, heartbeat, breathing rate, blood pressure, etc) are always numbers. We sometimes do not think about what they mean, but we often understand what’s better or worse. For example, we might feel okay about going 22 in a 20 mph school zone, but probably not 35. I might feel okay about a 105 cholesterol result but certainly not 150.
What might personal energy road signs be? The most important personal energy information would seem to be
-
How much are my ongoing energy costs, compared to other people?
-
How much of what kinds of fuel are being used to get the energy to me?
-
How much pollution and environmental damages are associated with it?
Yet many energy consultants give advice based on the house, not the people in it. It is common in most energy analysis software and reports to describe and compare heating and cooling equipment size, energy costs and use per square foot (sf) of floor area. This does not help with understanding per-person energy which can rise even as per-sf energy drops. A larger conditioned space often achieves a naturally lower heating + cooling energy requirement per sf and improving thermal efficiency of any structure (like airtightening and insulating wall cavities and attics) also reduces heating + cooling energy requirements per sf. But a single or 2-person household in a larger, even sometimes more thermally built home can result in more energy use per-person than if they were in a less thermally well-built smaller home. The most important energy information for a person should be more about the person.
Average home floor area per person in 2000 according to US DOE was about 760 sf. Per-person household energy was about 36 million equivalent BTUs per year per person. Average per-sf home energy usage was about 47 thousand equivalent BTUs. In regions where a large portion of annual energy use is heating and cooling, energy use is often compared to heating and cooling degree-days (DD, tallies of accummulated average daily temperature differences between inside and outside). Energy use per degree-day can be compared both per-sf and per-person.
Examine this summary and breakdown of my household energy use in 2010, what I call an “Energy Snapshot”.
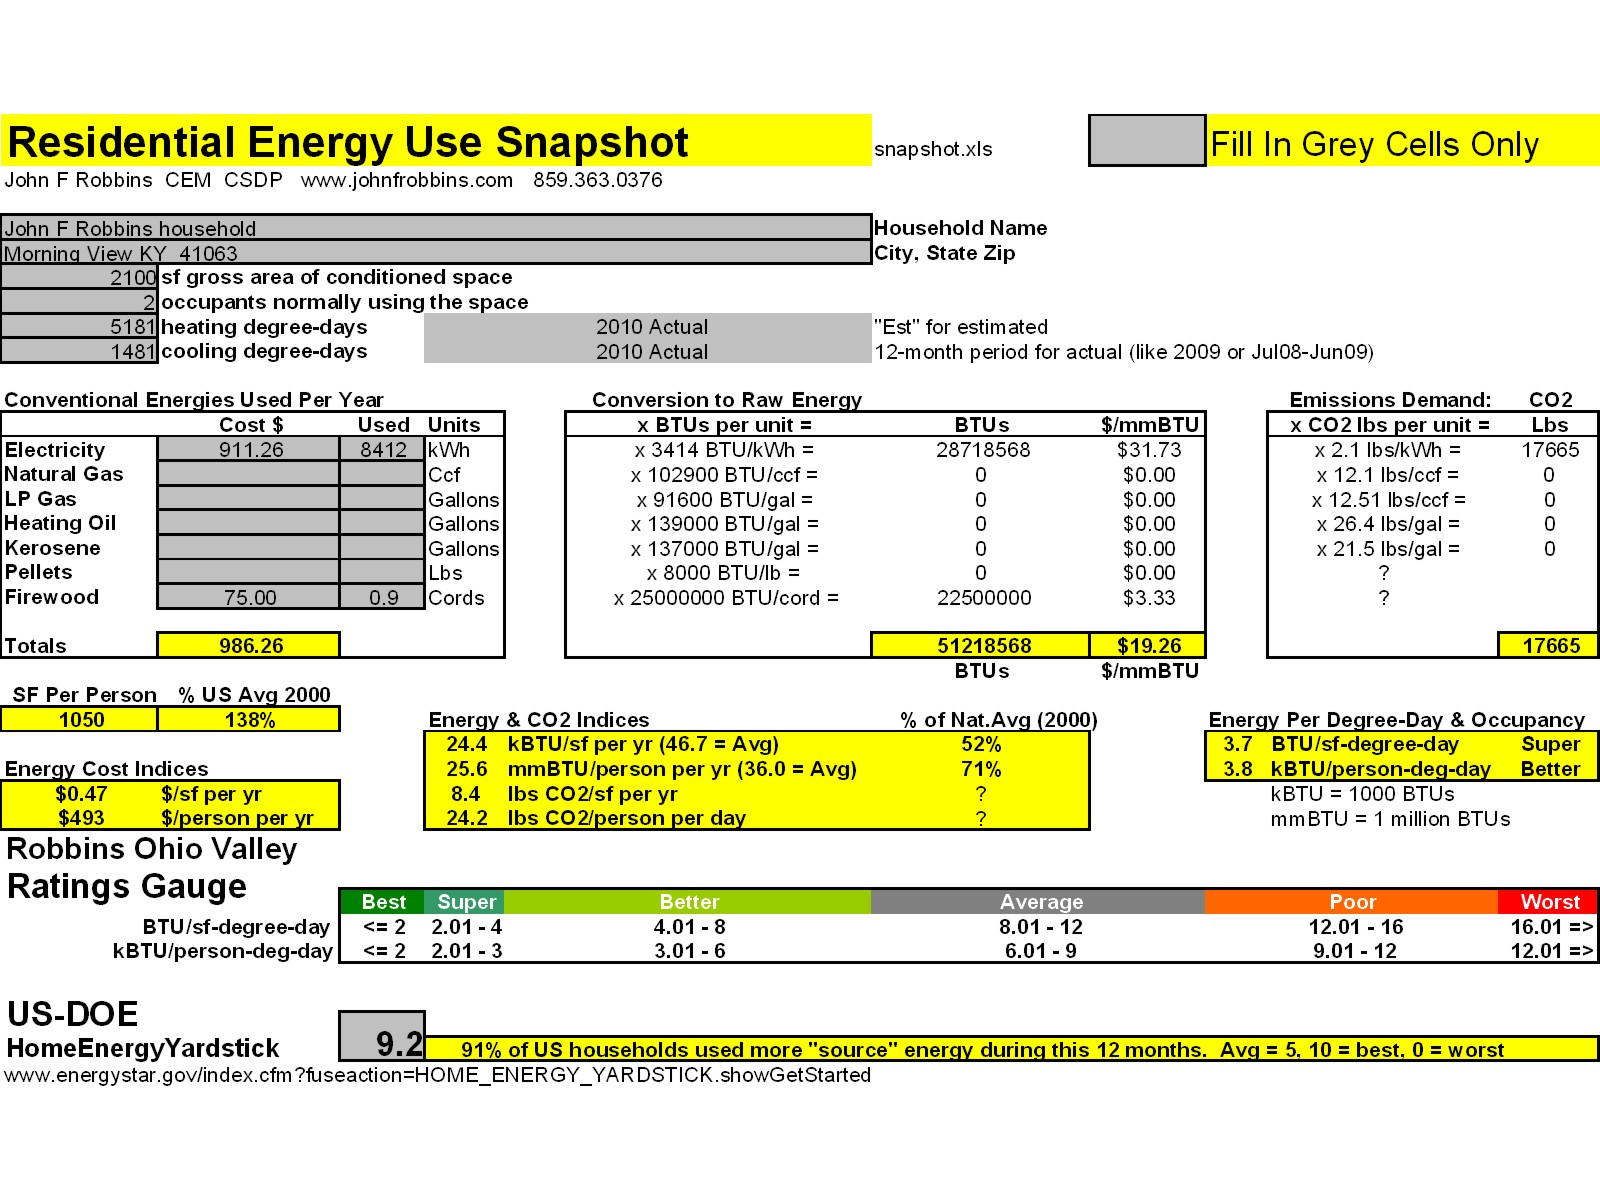
To understand this sheet, let’s break it into sections. In each grey cell, I enter the household information, also the local heating and cooling degree-days over the same period as the recorded energy use (or local averages if analyzing a new home design). Having visited and used EnergyStar’s “home energy yardstick” (see above for website), I also entered my 9.2 yardstick score. Mine is an existing house and household in 2010, so all my energy and degree-days numbers are actual.
Each line of energy input (in the grey box under “Conventional Energies”) is processed to show equivalent energy BTUs and associated CO2 (based averages per fuel, for electricity on local utility reports of its per kWh average). These results are in tables to the right of the raw energy use.
The middle section (going down now, where there are 3 side-by-side yellow boxes) shows various calculated usage indices compared to known averages or norms. The left-most box is about energy cost per sf and per person. The center box is about energy usage and CO2 per sf and per person, but not referenced to climate severity. Easy to see my 2010 usage per-sf was 52% and per-person was 71% of DOE-reported household averages in 2000. Right-most yellow box shows my per-sf and per-person energy use per degree-day, 3.7 and 3.8. Relate these to the color bar “Ohio Valley Ratings Gauge”. Easy to see our performance was “super” per sf and “better than average” per person compared to norms in my climate region.
The 9.2 Home Energy Yardstick score means according to EnergyStar, 91% of USA households used more energy than mine in 2010.
This is an example of clear and personal household energy information. Confirms that my usage is much lower by several gauges per person as well as per sf. However, because mine is an all-electric home serviced by a mostly coal-fired electric utility, my per-person household CO2 emission are certainly higher than the 9 pounds per person I’ve seen suggested as “sustainable”. Our electricity use has already been lowered substantially, but we will consider additional reductions over coming years.
I did some energy consulting for an urban homeowner recently who was so shocked at seeing how his energy use was so much greater than local and national averages that he became far more motivated to reduce a greater amount of his energy use. As an energy consultant, I can easily say that it is ideal to be TOLD by a customer how much energy use to try to cut. I very much prefer clients committed to challenging goals! In my experience, the least aggressive and interesting projects are those driven merely to qualify for subsidies. There is nothing wrong with looking for free money, but that can sometimes distract from accomplishing the greatest energy use and emissions reductions.
If there’s one thing we should agree about, we need to reduce our use of conventional energies substantially. Fortunately, there many ways to achieve that for most homeowners.